


Our Ten-Doorway Model: Assess & Plan
Dr. Galsworth’s “10-Doorway Model” is a special framework to help you identify the current level of visual thinking and visual competency in your enterprise and map out a pathway for making that stronger.
First, use the 10-Doorways to see and diagnose your current state. Then use it to plan your next transformational steps, based on the specific needs and goals of your company. Through the ten doorways, you will reach those goals. On the way, you will create a workforce of visual thinkers, enterprise-wide—from GM to managers and value-add associates, from engineers to planners, from the HR department to purchasing, marketing, and sales.
Each of the ten doorways is: 1) Linked to a specific organizational group—for example, in a factory—operators; supervisors; engineers; schedulers; material handlers; the executive team; and so on; and 2) Linked to a corresponding visual methodology—visual order; visual standards; visual displays; visual pull systems; visual leadership; and so on.
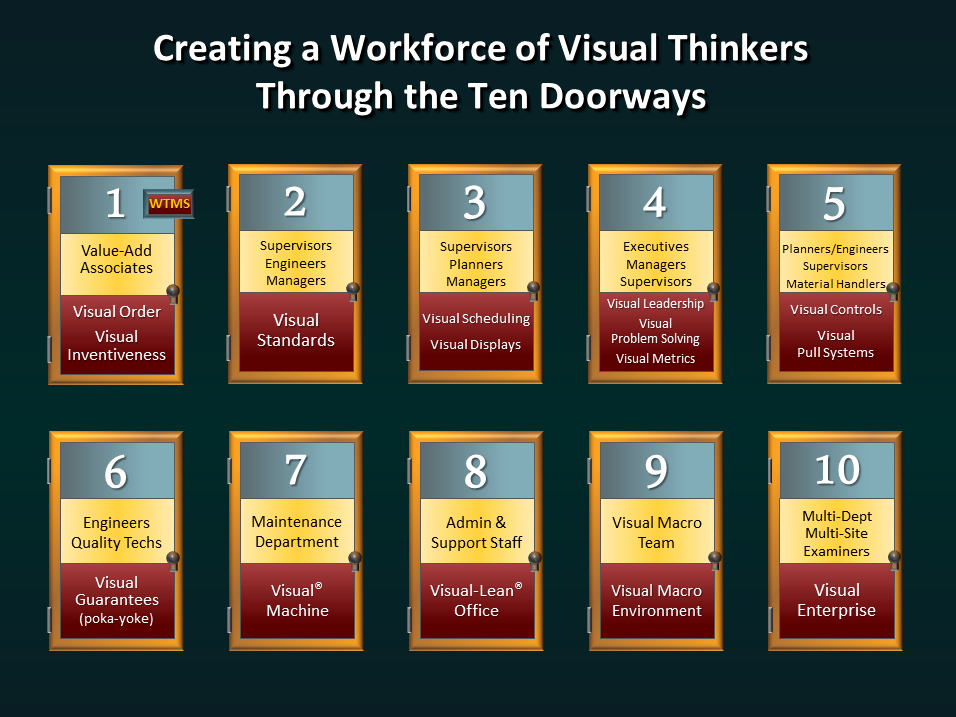
Groups then learn about and implement the visual method most closely linked to their performance outcomes. Once learned, this method allows each group to put the type of visual solution in place that helps them do their work with greater safety, precision, completeness, and on-time—all while reducing cost and increasing personal and professional performance effectiveness.
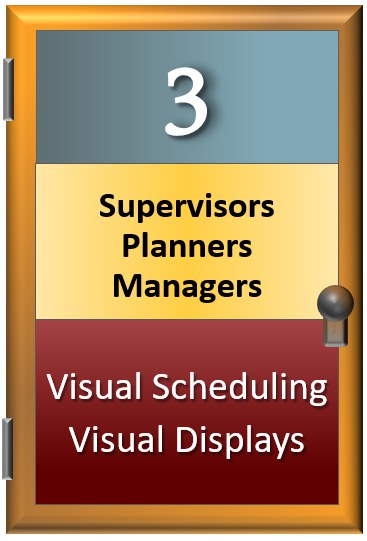
For example, managers and supervisors own Doorway 3. Their visual method of choice is: Visual Scheduling/Visual Display Boards. In Doorway 3, they learn why these boards are indispensable to their work and how to develop them in order to control and improve (for example): scheduling, manning, material consumption, change overs, defect frequency, and so on. These boards enable them to make timely, fact-based decisions, relying solely on the information on those boards. The information deficits that plague them are eradicated.
A visual assessment of your site will show doorway (or doorways) to open and when in order for you to achieve world-class visuality in your industry. Contact us for details.
Visual & Lean: Start Where You Are
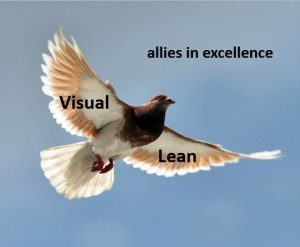
We see the relationship between visuality and lean like the two wings of a bird. One wing is for lean: time, the critical path, and pull. The other is for visuality: information, meaning, and adherence. Each wing is unique—and both wings are required in order for the bird to fly.
Would a bird wonder which of its two wings is more important? Would you?
Your company needs both visual and lean to get off the ground, sustain flight, and reach its destination and grow. This is the visual-lean® journey to operational excellence.
If you are already actively deploying lean.
The power of visuality will take your implementation deeper and wider, and enable you to:
a) eliminate minute information deficits that plague the workplace; and
b) create powerful visual linkages between all operational functions, including quality, maintenance, support, and admin.
The result of applying visual thinking in an active lean environment? Typically, a 15% to 30% decrease in overall and local lead time. That’s the power of letting a lean workplace speak!
If you have not yet started lean.
A favorite example is a stamping plant in Michigan that had stacks of inventory when we arrived—and stacks when we left, 18 months later. Yet, in the meantime, productivity (a roll-up of lead time, manning, quality, and on-time delivery) had improved by 27% to 38% in each department—and 22% across the factory. As for employee morale—well, let’s just say the company finally had some; and it was sparkling.
Do you wonder if you should wait until you’ve implemented lean to launch visual thinking? Based on three decades in the field, our answer is absolutely not . In fact, our experience shows that a strong visual workplace initiative— prior to lean—simplifies and stabilizes operations while grooming and aligning the employee mindset for change, inventiveness, and systematic thinking. Visuality paves the way for a resounding lean success.
Why wait? Understand where workplace visuality fits in, what it can do for you and your company—and why. Understand its power to transform and inspire even as it builds and secures performance. Start where you are. Start now.
Client Results: Financial & Cultural
The truth is this: Visuality is a gigantic adherence mechanism—the performance logic and cultural glue that lets the workplace speak and holds all other improvement initiatives together and makes their results sustainable.
Visual thinking—and the visual solutions that result—strengthens alignment when a healthy work culture already exists. And it creates one when a healthy work culture is lacking. Visuality builds ownership, empowerment, self-leadership, and visual inventiveness into all levels of the organization—supervisors, operators, staffs, and CEO inclusively. And the bottom-line impact is equally remarkable, even in the absence of lean or six sigma.
Here is a small sample from clients who focused exclusively on our visual workplace approach.
- Bottom Line Results
- Cultural Results
- Widening & Sustaining Lean and Six Sigma Gains
- Creating a Workforce of Visual Thinkers
- 96% Decrease in non-conformance assembly
- 68% Decrease in rack storage requirements
- 50% Decrease in time to conduct annual physical inventory
- 55% Decrease in classroom training needs
- 15% Increase in productivity increase
- Permanent removal of 700 hours of labor content per jet/unit
- Complete payback on training investment in seven units
- Ran out of chemicals on average of 1-3 times each shift
- 42 hours of downtime per week (= 2,184 downtime hours per year)
- Elimination of all stock outs
- Increase in production by 25%
- Zero hours per week downtime
- Decrease in scrap by $2,555,000 per year
- Decrease of 7,132 hours of downtime and operator cycle time
- Decrease in walking by 54%
- Elimination of all (100%) rework in plating process
- $15 million reduction in inventory (year one)
- Complete cultural conversion (year one)
- Supervisors across all shifts successfully training and coached visual outcomes
- 15% Increase in through put
- 70% Decrease in material handling
- 80% Decrease in flow distance
- 60% Decrease in floor space requirements

April Love, Trailmobile
Our visual conversion created tremendous cost reduction—absenteeism fell by 60%, production efficiency increased from 86% to 117%, supervisor retention and quality grew dramatically…
And when gas prices rose and the market dried up, the plant had to cut back to one shift (50% fewer employees). The result? The 117% efficiency level was sustained and increased by 7%.
Dr. Galsworth’s visual workplace approach has unlocked the potential of our employees. That potential was always there. We just couldn’t see it.
Now associates are the driving force behind not just change but our journey to excellence.
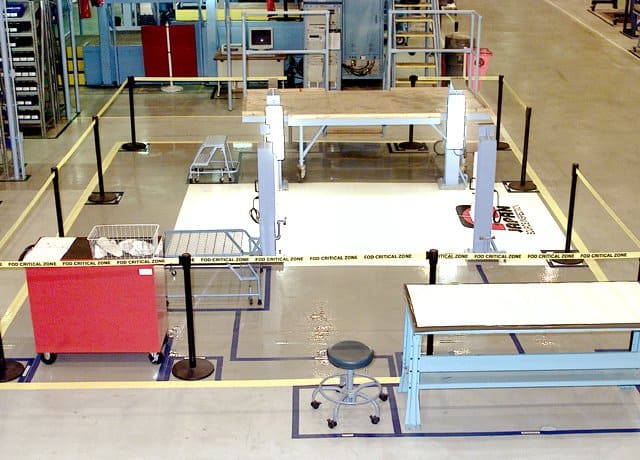
LM-Aero Inspection Area
You can’t take an F-16 fighter jet to the customer, so you invite the customer into your plant.
That’s when they see how we treat their parts, how we take care of their product while it’s in our care.
The visual workplace makes all of that visible—and very impressive: the product discipline, material handling, and the flow of the work.
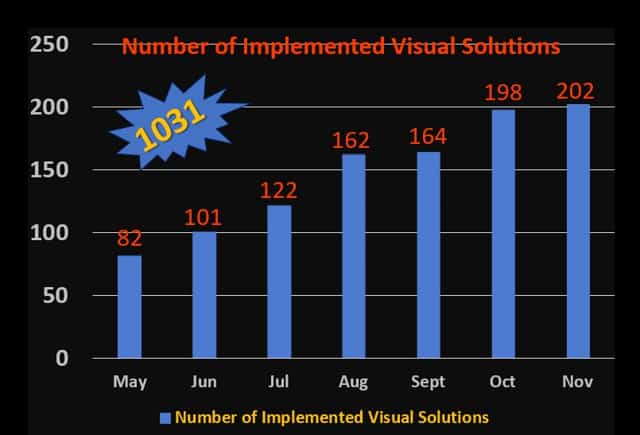
The Device Map
The operators launched their WTMS cycle in May—and by August, they had implemented over 1,000 visual solutions—and made a map to show them all. I was blown away. My team was blown away. Our corporate supply chain VP was blown away. He said he had never seen anything so impactful.
The operators continue. They do what they call “Lunch & Learn with Dr. Gwen”—watching and discussing the system, module by module, doing the follow up, and on and on. The numbers just keep getting better.